Methodology
SPRUCE uses third-party resources and models to estimate the environmental impact of cloud services. It enriches usage reports — AWS CUR, Azure cost details, or FOCUS exports from either provider — with additional columns, allowing users to do GreenOps and build dashboards and reports.
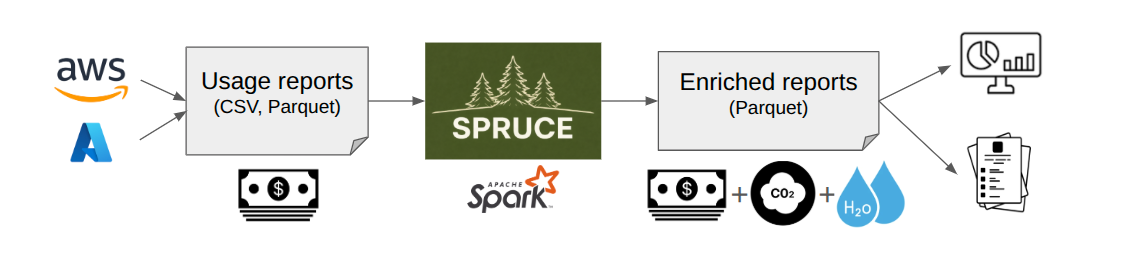
Unlike the information provided by CSPs (Cloud Service Providers), SPRUCE gives total transparency on how the estimates are built.
The overall approach is as follows:
- Estimate the energy used per activity (e.g. for X GB of data transferred, usage of an EC2 instance, storage etc.)
- Add overheads (e.g. PUE, WUE)
- Estimate water consumption (cooling and electricity generation)
- Apply accurate carbon intensity factors - ideally for a specific location at a specific time
- Where possible, estimate the embodied carbon related to the activity
This is compliant with the SCI specification from the GreenSoftware Foundation.
The main columns added by SPRUCE are:
operational_energy_kwh- amount of energy in kWh needed for using the corresponding service.
operational_emissions_co2eq_g- emissions of CO2 eq in grams from the energy usage.
embodied_emissions_co2eq_g- emissions of CO2 eq in grams embodied in the hardware used by the service, i.e. how much did it take to produce it.
The total emissions for a service are operational_emissions_co2eq_g + embodied_emissions_co2eq_g.
SPRUCE also estimates water consumption:
water_cooling_l- volume of water in litres used for data centre cooling
water_electricity_production_l- volume of water in litres consumed during electricity generation.
water_consumption_stress_area_l- total water consumption attributed to regions under high or extremely high water stress.
See the enrichment modules page for details on how each estimate is computed.
Everyday equivalences
The dashboard and the static report translate the emissions, energy, and water totals into everyday comparisons ("In everyday terms"). These conversions use documented, order-of-magnitude factors meant to build intuition, not precise accounting. The factors live in reporting/equivalences.py; the table below lists them with their sources.
| Comparison | Factor | Source |
|---|---|---|
| km in a family car | 0.17 kg CO2e/km | UK DEFRA/BEIS 2023 conversion factors |
| flight (London → New York, one-way economy) | 500 kg CO2e | atmosfair flight calculator |
| hour of video streaming | 36 g CO2e | IEA, The carbon footprint of streaming video |
| tree-year of CO2 absorption | 21 kg CO2 | EPA Greenhouse Gas Equivalencies Calculator |
| home powered for a year | 3,500 kWh | Eurostat, Energy consumption in households |
| cup of tea boiled | 0.03 kWh | typical electric kettle, ~0.25 L |
| smartphone charge | 0.012 kWh | EPA Greenhouse Gas Equivalencies Calculator |
| solar-panel day | 1.5 kWh | typical ~400 W rooftop panel |
| Olympic swimming pool | 2,500,000 L | 2,500 m³ nominal volume |
| bathtub filled | 150 L | typical domestic tub |
| washing machine cycle | 50 L | typical modern front loader |
| m²-year of rainfall | 750 L | ~715 mm global land average |