Introduction
![]()
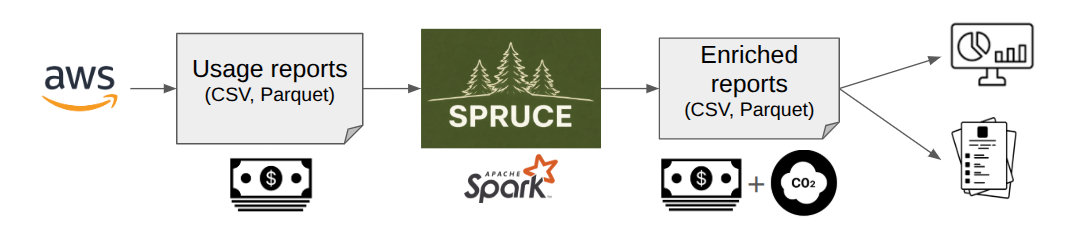
SPRUCE helps estimate the environmental impact of your cloud usage. By leveraging open source models and data, it enriches usage reports generated by cloud providers and allows you to build reports and visualisations. Having the GreenOps and FinOps data in the same place makes it easier to expose your costs and impacts side by side.
Please note that SPRUCE handles only CUR reports from AWS and not all their services are covered. However, most of the cost from a typical usage already gets estimates.
SPRUCE uses Apache Spark® to read and write the usage reports (typically in Parquet format) in a scalable way and, thanks to its modular approach, splits the enrichment of the data into configurable stages.
A typical sequence of stages would be:
- estimation of embodied emissions from the hardware
- estimation of energy used
- estimation of water consumption
- application of PUE and other overheads
- application of carbon intensity factors
Have a look at the methodology section for more details.
One of the benefits of using Apache Spark is that you can use EMR on AWS to enrich the CURs at scale without having to export or expose any of your data.
The code of the project is in our GitHub repo.
SPRUCE is licensed under the Apache License, Version 2.0.
Quick start using Docker 🐳
Prerequisites
You will need to have CUR reports as inputs. Those are generated via Data Exports and stored on S3 as Parquet files. See instructions on Generate Cost and Usage Reports.
For this tutorial, we will assume that you copied the S3 files to your local file system. You can do this with the AWS CLI
aws s3 cp s3://{bucket}/{prefix}/{data_export_name}/data/ curs --recursive
You will also need to have Docker installed.
With Docker
Pull the latest Docker image with
docker pull ghcr.io/digitalpebble/spruce
This retrieves a Docker image containing Apache Spark as well as the SPRUCE jar.
The command below processes the data locally by mounting the working directory as a volume. The input CURs are assumed to be in a directory called curs.
docker run --rm -v $(pwd):/workspace -w /workspace \
ghcr.io/digitalpebble/spruce \
-i curs -o output
The -i parameter specifies the location of the directory containing the CUR reports in Parquet format.
The -o parameter specifies the location of enriched Parquet files generated in output.
The option -c allows to specify a JSON configuration file to override the default settings.
The directory output contains an enriched copy of the input CURs. See Explore the results to understand what the output contains.
Quick start using Apache Spark
Instead of using a container, you can run SPRUCE directly on Apache Spark either locally or on a cluster.
Prerequisites
You will need to have CUR reports as inputs. Those are generated via Data Exports and stored on S3 as Parquet files. See instructions on Generate Cost and Usage Reports.
For this tutorial, we will assume that you copied the S3 files to your local file system. You can do this with the AWS CLI
aws s3 cp s3://{bucket}/{prefix}/{data_export_name}/data/ curs --recursive
To run SPRUCE locally, you need Apache Spark installed and added to the $PATH.
Finally, you need the JAR containing the code and resources for SPRUCE. You can copy it from the latest release or alternatively, build from source, which requires Apache Maven and Java 17 or above.
mvn clean package
Run on Apache Spark
If you downloaded a released jar, make sure the path matches its location.
spark-submit --class com.digitalpebble.spruce.SparkJob --driver-memory 8g ./target/spruce-*.jar -i ./curs -o ./output
The -i parameter specifies the location of the directory containing the CUR reports in Parquet format.
The -o parameter specifies the location of enriched Parquet files generated in output.
The option -c allows to specify a JSON configuration file to override the default settings.
The directory output contains an enriched copy of the input CURs. See Explore the results to understand what the output contains.
Explore the results
Interactive dashboard
For an interactive view of SPRUCE-enriched Parquet output, use the Streamlit
example described in Build a simple dashboard. It
reads the same inputs as report.py and runs DuckDB queries locally.
Automated report
The easiest way to explore SPRUCE output is report.py, a Python script that reads enriched Parquet files, runs all the analyses described on this page automatically, and writes a formatted report — no SQL required.
Installation
pip install -r reporting/requirements-report.txt # duckdb (+ markdown, weasyprint for html/pdf)
Usage
# Markdown to stdout
python reporting/report.py -i output/

# Write to a file — format is inferred from the suffix
python reporting/report.py -i output/ -o report.md
python reporting/report.py -i output/ -o report.html
python reporting/report.py -i output/ -o report.pdf

# Read directly from S3 (uses ambient AWS credentials)
python reporting/report.py -i s3://my-bucket/spruced/ -o report.html
| Flag | Default | Description |
|---|---|---|
-i / --input | required | Local directory, glob, or S3 URI |
-o / --output | stdout | Output file; format inferred from suffix (.md, .html, .pdf) |
-t / --top-tags | 10 | Maximum number of resource tags offered for interactive breakdown |
What it produces
The report covers the following sections, drawn from the queries documented below:
| Section | What it shows |
|---|---|
| Summary by Billing Period | Energy (kWh), operational CO₂ (kg), embodied CO₂ (kg), water usage (l) |
| Top Emitters by Service | Top 20 product/service/operation combinations by operational CO₂ |
| Top Instance Types | Top 20 instance families by operational + embodied CO₂ |
| Coverage | % of unblended costs that have emissions data; top 20 uncovered services by cost |
| Regional Analysis | CO₂, energy, carbon intensity, water, PUE, and gCO₂/$ per AWS region |
| Tag Breakdown | Interactive: emissions split by any resource tag present in the data |
| Recommendations | Automatically generated from coverage gaps, regional carbon intensity, instance families, and billing trends |
After the fixed sections, the script scans resource_tags and presents an interactive menu of the most consistently used tag keys, ordered by the percentage of line items that carry a non-empty value. Select a tag to see the emissions breakdown by tag value; press Enter when done. If no tags are found, the report states this clearly.
Recommendations are generated automatically from the data:
| Signal | Condition | Message |
|---|---|---|
| Coverage gap | < 80 % of costs covered | Lists top uncovered services by cost |
| Carbon intensity | Region > 300 gCO₂/kWh with a lower-intensity alternative present | Suggests migration |
| Instance family | Top emitter is an x86 family with a Graviton equivalent | Names the Graviton replacement |
| Emissions trend | ≥ 2 billing periods, last > first × 1.10 | Flags the percentage increase |
Manual queries
As an alternative to the script above, you can also write equivalent SQL queries using DuckDB locally (or Athena if the output was written to S3):
Breakdown by billing period
create table enriched_curs as select * from 'output/**/*.parquet';

select
       BILLING_PERIOD,
       round(sum(operational_emissions_co2eq_g) / 1000, 2) as co2_usage_kg,
       round(sum(embodied_emissions_co2eq_g) / 1000, 2) as co2_embodied_kg,
       round(sum(operational_energy_kwh),2) as energy_usage_kwh
       from enriched_curs
       group by BILLING_PERIOD
       order by BILLING_PERIOD;
This should give an output similar to
| BILLING_PERIOD | co2_usage_kg | co2_embodied_kg | energy_usage_kwh |
|---|---|---|---|
| 2025-05 | 863.51 | 89.73 | 2029.15 |
| 2025-06 | 774.01 | 85.01 | 1811.98 |
| 2025-07 | 812.07 | 87.19 | 1901.13 |
| 2025-08 | 848.7 | 88.15 | 1982.56 |
| 2025-09 | 866.24 | 86.76 | 2017.36 |
Breakdown per product, service and operation
select line_item_product_code, product_servicecode, line_item_operation,
       round(sum(operational_emissions_co2eq_g)/1000,2) as co2_usage_kg,
       round(sum(embodied_emissions_co2eq_g)/1000, 2) as co2_embodied_kg,
       round(sum(operational_energy_kwh),2) as energy_usage_kwh
       from enriched_curs where operational_emissions_co2eq_g > 0.01
       group by all
       order by 4 desc, 5 desc, 6 desc, 2;
This should give an output similar to
| line_item_product_code | product_servicecode | line_item_operation | co2_usage_kg | co2_embodied_kg | energy_usage_kwh |
|---|---|---|---|---|---|
| AmazonECS | AmazonECS | FargateTask | 1499.93 | NULL | 3784.91 |
| AmazonEC2 | AmazonEC2 | RunInstances | 1365.7 | 433.57 | 3068.87 |
| AmazonS3 | AmazonS3 | GlacierInstantRetrievalStorage | 554.85 | NULL | 1224.13 |
| AmazonS3 | AmazonS3 | OneZoneIAStorage | 249.22 | NULL | 548.48 |
| AmazonS3 | AmazonS3 | StandardStorage | 210.57 | NULL | 469.54 |
| AmazonEC2 | AmazonEC2 | CreateVolume-Gp3 | 102.27 | NULL | 230.39 |
| AmazonEC2 | AmazonEC2 | RunInstances:SV001 | 66.41 | 3.27 | 146.15 |
| AmazonDocDB | AmazonDocDB | CreateCluster | 49.93 | NULL | 109.89 |
| AmazonS3 | AmazonS3 | IntelligentTieringAIAStorage | 17.02 | NULL | 37.47 |
| AmazonEC2 | AmazonEC2 | CreateVolume-Gp2 | 11.03 | NULL | 34.37 |
| AmazonS3 | AmazonS3 | StandardIAStorage | 9.02 | NULL | 19.85 |
| AmazonEC2 | AmazonEC2 | CreateSnapshot | 8.05 | NULL | 20.6 |
| AmazonECR | AmazonECR | TimedStorage-ByteHrs | 6.96 | NULL | 15.31 |
| AmazonEC2 | AWSDataTransfer | RunInstances | 2.8 | NULL | 6.25 |
| AmazonS3 | AmazonS3 | OneZoneIASizeOverhead | 2.23 | NULL | 4.9 |
| AmazonS3 | AWSDataTransfer | GetObjectForRepl | 1.84 | NULL | 4.06 |
| AmazonS3 | AWSDataTransfer | UploadPartForRepl | 1.66 | NULL | 3.64 |
| AmazonS3 | AmazonS3 | DeleteObject | 1.45 | NULL | 3.2 |
| AmazonMQ | AmazonMQ | CreateBroker:0001 | 1.16 | NULL | 2.55 |
| AmazonECR | AmazonECR | EUW2-TimedStorage-ByteHrs | 0.43 | NULL | 2.16 |
| AmazonS3 | AmazonS3 | StandardIASizeOverhead | 0.3 | NULL | 0.65 |
| AmazonS3 | AWSDataTransfer | PutObjectForRepl | 0.19 | NULL | 0.42 |
| AWSBackup | AWSBackup | Storage | 0.13 | NULL | 0.64 |
| AmazonS3 | AmazonS3GlacierDeepArchive | DeepArchiveStorage | 0.1 | NULL | 0.22 |
| AmazonS3 | AWSDataTransfer | PutObject | 0.08 | NULL | 0.17 |
| AmazonECR | AWSDataTransfer | downloadLayer | 0.07 | NULL | 0.19 |
| AmazonEC2 | AWSDataTransfer | PublicIP-In | 0.06 | NULL | 0.14 |
| AmazonCloudWatch | AmazonCloudWatch | HourlyStorageMetering | 0.02 | NULL | 0.05 |
| AmazonEFS | AmazonEFS | Storage | 0.01 | NULL | 0.03 |
Cost coverage
To measure the proportion of the costs for which emissions were calculated
select
  round(covered * 100 / "total costs", 2) as percentage_costs_covered
from (
  select
    sum(line_item_unblended_cost) as "total costs",
    sum(line_item_unblended_cost) filter (where operational_emissions_co2eq_g is not null) as covered
  from
    enriched_curs
  where
    line_item_line_item_type like '%Usage'
);
The figure will vary depending on the services you use. We have measured up to 77% coverage for some users.
Breakdown per region
with agg as (
    select
        region as region_code,
        sum(operational_emissions_co2eq_g) as operational_emissions_g,
        sum(embodied_emissions_co2eq_g) as embodied_emissions_g,
        sum(operational_energy_kwh) as energy_kwh,
        sum(pricing_public_on_demand_cost) as public_cost,
        avg(carbon_intensity) as avg_carbon_intensity,
        avg(power_usage_effectiveness) as pue
    from enriched_curs
    where operational_emissions_co2eq_g is not null
    group by 1
)
select
    region_code,
    round(operational_emissions_g / 1000, 2) as co2_usage_kg,
    round(energy_kwh, 2) as energy_usage_kwh,
    round(avg_carbon_intensity, 2) as carbon_intensity,
    round(pue,2) as pue,
    round((operational_emissions_g + embodied_emissions_g) / public_cost, 2) as g_co2_per_dollar
from agg
order by energy_usage_kwh desc, co2_usage_kg desc, region_code desc;
g_co2_per_dollar being the total emissions (usage + embodied) divided by the public on demand cost.
Below is an example of what the results might look like.
| region_code | co2_usage_kg | energy_usage_kwh | carbon_intensity | pue | g_co2_per_dollar |
|---|---|---|---|---|---|
| us-east-1 | 9292.05 | 17969.69 | 400.33 | 1.15 | 33.94 |
| us-east-2 | 1569.79 | 3089.49 | 400.33 | 1.13 | 164.47 |
| eu-west-2 | 583.54 | 2674.09 | 175.03 | 1.11 | 22.32 |
| eu-north-1 | 0.35 | 13.95 | 20.42 | 1.1 | 6.84 |
Breakdown per user tag
User tags are how environmental impacts can be allocated to a business unit, team, product, environment etc… It is as fundamental for a GreenOps practice as it is for FinOps.
By enriching data at the finest possible level, SPRUCE allows to aggregate the impacts by the tags that are relevant for a given organisation. The syntax to do so for a tag cost_category_top_level would be for instance
select resource_tags['cost_category_top_level'],
       round(sum(operational_energy_kwh),2) as energie_kwh,
       round(sum(operational_emissions_co2eq_g) / 1000, 2) as operational_kg,
       round(sum(embodied_emissions_co2eq_g) / 1000, 2)    as embodied_kg
       from enriched_curs
       group by 1
       order by 3 desc;
Methodology
SPRUCE uses third-party resources and models to estimate the environmental impact of cloud services. It enriches cost usage reports (CUR) with additional columns, allowing users to do GreenOps and build dashboards and reports.
Unlike the information provided by CSPs (Cloud Service Providers), SPRUCE gives total transparency on how the estimates are built.
The overall approach is as follows:
- Estimate the energy used per activity (e.g. for X GB of data transferred, usage of an EC2 instance, storage etc.)
- Add overheads (e.g. PUE, WUE)
- Estimate water consumption (cooling and electricity generation)
- Apply accurate carbon intensity factors - ideally for a specific location at a specific time
- Where possible, estimate the embodied carbon related to the activity
This is compliant with the SCI specification from the GreenSoftware Foundation.
The main columns added by SPRUCE are:
operational_energy_kwh: amount of energy in kWh needed for using the corresponding service.operational_emissions_co2eq_g: emissions of CO2 eq in grams from the energy usage.embodied_emissions_co2eq_g: emissions of CO2 eq in grams embodied in the hardware used by the service, i.e. how much did it take to produce it.
The total emissions for a service are operational_emissions_co2eq_g + embodied_emissions_co2eq_g.
SPRUCE also estimates water consumption:
water_cooling_l: volume of water in litres used for data centre cooling.water_electricity_production_l: volume of water in litres consumed during electricity generation.water_consumption_stress_area_l: total water consumption attributed to regions under high or extremely high water stress.
See the enrichment modules page for details on how each estimate is computed.
Enrichment modules
SPRUCE generates its estimates by chaining EnrichmentModules.
An EnrichmentModule is the unit of extension in SPRUCE. Each module reads columns from
the CUR input row and/or from values set by earlier modules, then writes its results into a
shared map. The pipeline materialises one output row per CUR row at the end, avoiding
per-module row copies.
For instance, the AverageCarbonIntensity.java module applies average carbon intensity factors to energy estimates based on the region in order to generate operational emissions.
The list of columns generated by the modules can be found in the SpruceColumn class.
The enrichment modules are listed and configured in a configuration file, one per cloud provider. If no configuration is specified, SPRUCE uses the bundled default for the active provider (e.g. default-config-aws.json for AWS).
See Configure the modules for instructions on how to modify the enrichment modules.
Cloud Carbon Footprint
The following modules implement the heuristics from the Cloud Carbon Footprint project.
ccf.aws.Storage
Provides an estimate of energy used for storage by applying a flat coefficient per Gb, following the approach used by the Cloud Carbon Footprint project. Service-specific replication factors are applied. See methodology for more details.
The HDD and SSD coefficients (in Wh per TB-hour) can be overridden via configuration:
| Key | Default | Description |
|---|---|---|
hdd_coefficient_tb_h | 0.65 | Energy per TB-hour for HDD storage |
ssd_coefficient_tb_h | 1.2 | Energy per TB-hour for SSD storage |
Output column: operational_energy_kwh.
ccf.aws.Accelerators
Provides an estimate of energy used by accelerators, following the approach used by the Cloud Carbon Footprint project. See methodology for more details.
Output column: operational_energy_kwh.
Boavizta
The following modules make use of the BoaviztAPI.
boavizta.aws.BoaviztAPI
Provides an estimate of final energy used for computation (EC2, OpenSearch, RDS) as well as the related embodied emissions using the BoaviztAPI.
Output columns: operational_energy_kwh, embodied_emissions_co2eq_g and embodied_adp_sbeq_g.
From https://doc.api.boavizta.org/Explanations/impacts/
Abiotic Depletion Potential (ADP) is an environmental impact indicator. This category corresponds to mineral and resources used and is, in this sense, mainly influenced by the rate of resources extracted. The effect of this consumption on their depletion is estimated according to their availability stock at a global scale. This impact category is divided into two components: a material component and a fossil fuels component (we use a version of ADP which include both). This impact is expressed in grams of antimony equivalent (gSbeq).
Source: sciencedirect
boavizta.aws.BoaviztAPIstatic
Similar to the previous module but does not get the information from an instance of the BoaviztAPI but from a static file generated from it. This makes it simpler to use SPRUCE.
Output columns: operational_energy_kwh, embodied_emissions_co2eq_g and embodied_adp_sbeq_g.
EcoLogits
The following modules estimate the energy consumption and embodied emissions of LLM inference using static coefficients derived from the EcoLogits project.
ecologits.BedrockEcoLogits
Provides an estimate of energy consumption and embodied emissions for LLM inference on AWS Bedrock, based on static per-model coefficients from the EcoLogits project. This follows the same pattern as boavizta.aws.BoaviztAPIstatic: a static data file bundled in the JAR is loaded at initialisation time, and the module matches Bedrock CUR rows to per-model coefficients to compute energy usage and embodied emissions.
The module parses the line_item_usage_type field (format: {REGION}-{ModelKey}-{input|output}-tokens[-batch]) to extract both the model key and the token type, then normalises the token count from pricing_unit (handling real-world values such as 1K tokens or 1M tokens). Only output-token rows are scored — the EcoLogits methodology attributes ~all generation cost to the autoregressive output phase, so input-token rows are skipped.
Output columns: operational_energy_kwh and embodied_emissions_co2eq_g.
Batch size assumption: EcoLogits hardcodes a batch size of
B=64concurrent requests. The resulting coefficients are a mid-batch estimate — they underestimate energy for low-traffic scenarios and overestimate it for high-throughput batch inference (e.g. Bedrock Batch mode). MakingBdynamic requires provider telemetry not available in billing data.
ember.AverageCarbonIntensity
Adds average carbon intensity factors derived from Ember’s electricity data, distributed under the Creative Commons Attribution Licence (CC-BY-4.0).
Values are keyed directly by cloud provider and region (e.g. aws:us-east-1). For regions in countries with sub-national data (currently the US and India), the carbon intensity is taken from the Ember value for the state hosting the data centre; otherwise the country-level Ember value is used.
The data is loaded from src/main/resources/ember/ember_co2_intensity.csv, which is generated from cloud_regions.json — see the scripts under scripts/ and the dedicated README for how to refresh it.
Output column: carbon_intensity.
Cloud region metadata
SPRUCE ships with src/main/resources/cloud_regions.json, a single JSON file
listing the AWS, GCP, and Azure cloud regions together with their location
(country, metro area, latitude/longitude), service status, and number of
availability zones. It is the canonical source for the region-to-location
mapping used by other modules and resource files (e.g. ember.AverageCarbonIntensity).
The file is produced in two steps by scripts under scripts/, see scripts/README.md for the full usage details.
RegionExtraction
Extracts the region information from the input and stores it in a standard location.
Output column: region.
PUE
Uses the 2024 data published by AWS for Power Usage Effectiveness to rows for which energy usage has been estimated. This provides a more accurate and up to date approach than the flat rate approach in the CCF methodology.
Output column: power_usage_effectiveness.
Water
Estimates water consumption associated with cloud usage, producing three columns:
-
water_cooling_l– the volume of water (in litres) used for data centre cooling. Computed asoperational_energy_kwh×power_usage_effectiveness× WUE, where WUE (Water Usage Effectiveness) is the ratio of litres of water consumed for cooling per kWh of IT energy. The per-region WUE values come from the 2024 data published by AWS. -
water_electricity_production_l– the volume of water (in litres) consumed during electricity generation to power the data centre. Computed asoperational_energy_kwh×power_usage_effectiveness× WCF, where WCF (Water Consumption Factor) represents the litres of water consumed per kWh of electricity generated. The WCF values per electricity grid zone are sourced from the WRI methodology for calculating water use embedded in purchased electricity. -
water_consumption_stress_area_l– the total water consumption (water_cooling_l+water_electricity_production_l) attributed to regions under high or extremely high water stress (Aqueduct 4.0 baseline water stress category ≥ 3). This field is only populated when the electricity grid zone for the region has a water stress category of 3 (High) or 4 (Extremely High); it is absent otherwise. Water stress categories are derived from the WRI Aqueduct 4.0 dataset. The World Resource Institute’s Aqueduct tool is licensed through Creative Commons. The data has been extracted and mapped to cloud provider region codes.
Output columns: water_cooling_l, water_electricity_production_l, and water_consumption_stress_area_l.
aws.Networking
Provides an estimate of energy used for networking in and out of data centres. The module distinguishes between three transfer types with separate coefficients (in kWh/Gb):
| Transfer type | Key | Default | Description |
|---|---|---|---|
| Intra-region | intra | 0.001 | Traffic within the same region |
| Inter-region | inter | 0.0015 | Traffic between AWS regions |
| External | extra | 0.059 | Traffic to/from the internet (AWS Inbound / Outbound) |
The coefficients are taken from the Boavizta Cloud Emissions Working Group and can be overridden via the network_coefficients_kwh_gb configuration map.
The relevance and usefulness of attributing emissions for networking based on usage is subject for debate as the energy use of networking is pretty constant independently of traffic. The consequences of reducing networking are probably negligible but since the approach in SPRUCE is attributional, we do the same for networking in order to be consistent.
Output column: operational_energy_kwh.
aws.Serverless
Provides an estimate of energy for the memory and vCPU usage of serverless services like Fargate or EMR. The default coefficients are taken from the Tailpipe methodology and can be overridden via configuration:
| Key | Default | Description |
|---|---|---|
memory_coefficient_kwh | 0.0000598 | kWh per GB of memory |
arm_cpu_coefficient_kwh | 0.00191015625 | kWh per vCPU (ARM) |
x86_cpu_coefficient_kwh | 0.0088121875 | kWh per vCPU (x86) |
Output column: operational_energy_kwh.
OperationalEmissions
Computes operational emissions based on the energy usage, average carbon intensity factors and power_usage_effectiveness estimated by the preceding modules, based on the region. It also accounts for two additional overheads:
- Power Supply Efficiency: The power lost between the data centre mains electricity and the server (default
1.04). - Power Transmission Losses: The power lost between the power station and the data centre mains electricity (default
1.08).
These two values can be overridden via configuration (powerSupplyEfficiency and powerTransmissionLosses).
operational_emissions_co2eq_g is equal to operational_energy_kwh * carbon_intensity * power_usage_effectiveness * powerSupplyEfficiency * powerTransmissionLosses.
Output columns: operational_emissions_co2eq_g.
Comparison with other open source tools
SPRUCE is part of a growing ecosystem of open source tools focused on measuring and reducing the environmental impact of cloud computing. This page compares SPRUCE with other notable open source projects in this space.
Cloud Carbon Footprint (CCF)
Cloud Carbon Footprint is an open source tool that provides cloud carbon emissions estimates.
Note: Cloud Carbon Footprint is no longer actively maintained. As a result, its data and methodology may be outdated. SPRUCE implements CCF’s core methodology but with actively maintained data sources and models.
Similarities
- Both tools estimate the carbon footprint of cloud usage
- Both support AWS (as well as GCP and Azure for CCF)
- Both use comparable methodologies for calculating operational emissions
- Both are open source and transparent about their calculation methods
- SPRUCE implements several modules based on CCF’s methodology (see Cloud Carbon Footprint modules)
Key Differences
| Feature | SPRUCE | Cloud Carbon Footprint |
|---|---|---|
| Architecture | Apache Spark-based for scalable data processing | Node.js application with web dashboard |
| Data Processing | Batch processing of Cost and Usage Reports (CUR) in Parquet format | Real-time API calls to cloud providers |
| Primary Use Case | Enrichment of existing usage reports for GreenOps + FinOps | Standalone dashboard for carbon tracking |
| Deployment | Runs on-premises or in the cloud (e.g., EMR) without exposing data | Requires credentials to query cloud provider APIs |
| Data Privacy | Processes data locally, no external API calls for core functionality | Requires cloud provider credentials |
| Modularity | Highly modular with configurable enrichment pipelines | Fixed calculation pipeline with configuration options |
| Output | Enriched Parquet/CSV files for custom analytics and visualization | Pre-built dashboard and recommendations |
| Embodied Carbon | Includes embodied emissions via Boavizta integration | Limited embodied carbon estimates |
| Scalability | Designed for large-scale data processing with Apache Spark | Suitable for smaller to medium deployments |
| Carbon Intensity | Uses Ember average data | Default factors outdated |
| Maintenance Status | Actively maintained with regular updates | No longer actively maintained |
| Complexity | Easy to run on Docker | Challenging to set up |
When to Choose SPRUCE
- You want to combine GreenOps and FinOps data in a single workflow
- You need to process large volumes of historical CUR data
- You prefer to keep your usage data within your own infrastructure
- You want to build custom dashboards and reports with tools like DuckDB, Tableau, or PowerBI
- You need fine-grained control over the calculation methodology through configurable modules
- You want access to data at the lowest-possible granularity and control what gets displayed and how
CloudScanner
![]()
CloudScanner is an open source tool by Boavizta that focuses on estimating the environmental impact of cloud resources.
Similarities
- Both tools estimate the environmental impact of cloud usage
- Both are open source and transparent about their methodologies
- Both can work with AWS cloud resources
- Both use data from the BoaviztAPI
Key Differences
| Feature | SPRUCE | CloudScanner |
|---|---|---|
| Primary Purpose | Enrichment of Cost and Usage Reports (CUR) for GreenOps + FinOps | Direct resource scanning for environmental impact |
| Architecture | Apache Spark-based batch processing | Direct API-based resource scanning |
| Data Source | Cost and Usage Reports (CUR) in Parquet/CSV format | Live cloud resource inventory via cloud provider APIs |
| Scope | Focuses on AWS CUR data enrichment | Limited to EC2 |
| Integration | Enriches existing billing data for FinOps alignment | Standalone tool for environmental assessment |
| Scalability | Designed for large-scale historical data processing | Suitable for periodic resource audits |
| Output | Enriched reports in Parquet/CSV for custom analytics | Prometheus metrics and Grafana dashboard |
| Accuracy | Uses Ember intensity factors | Uses outdated factors from BoaviztAPI |
When to Choose SPRUCE
- You want to combine environmental impact with cost data from CUR reports
- You need to process large volumes of historical usage data
- You prefer batch processing over real-time scanning
- You want fine-grained control through configurable enrichment modules
- You need to integrate with existing FinOps workflows
- You want more accurate estimates and coverage beyond EC2
Other Related Tools
Kepler (Kubernetes Efficient Power Level Exporter)
Kepler is a CNCF project that exports energy-related metrics from Kubernetes clusters.
Key difference: Kepler focuses on real-time power consumption metrics at the container/pod level using eBPF, while SPRUCE focuses on enriching historical cost reports with carbon estimates at the service level.
Scaphandre
Scaphandre is a power consumption monitoring agent that can export metrics to various monitoring systems.
Key difference: Scaphandre provides real-time power measurements at the host/process level, while SPRUCE provides carbon estimates based on cloud usage patterns and billing data.
Please open an issue to suggest another project or an improvement to this page.
Generate CUR reports
You will need to have CUR reports as inputs. Those are generated via Data Exports and stored on S3 as Parquet files.
The Data Export will automatically populate the CURv2 reports. You can open a support ticket with AWS to get the reports backfilled with historical data.
AWS Console
In the Billing and Cost Management section, go to Cost and Usage Analysis then Data Export. Click on Create:
Give your export a name, click on Include Resource IDs as shown below
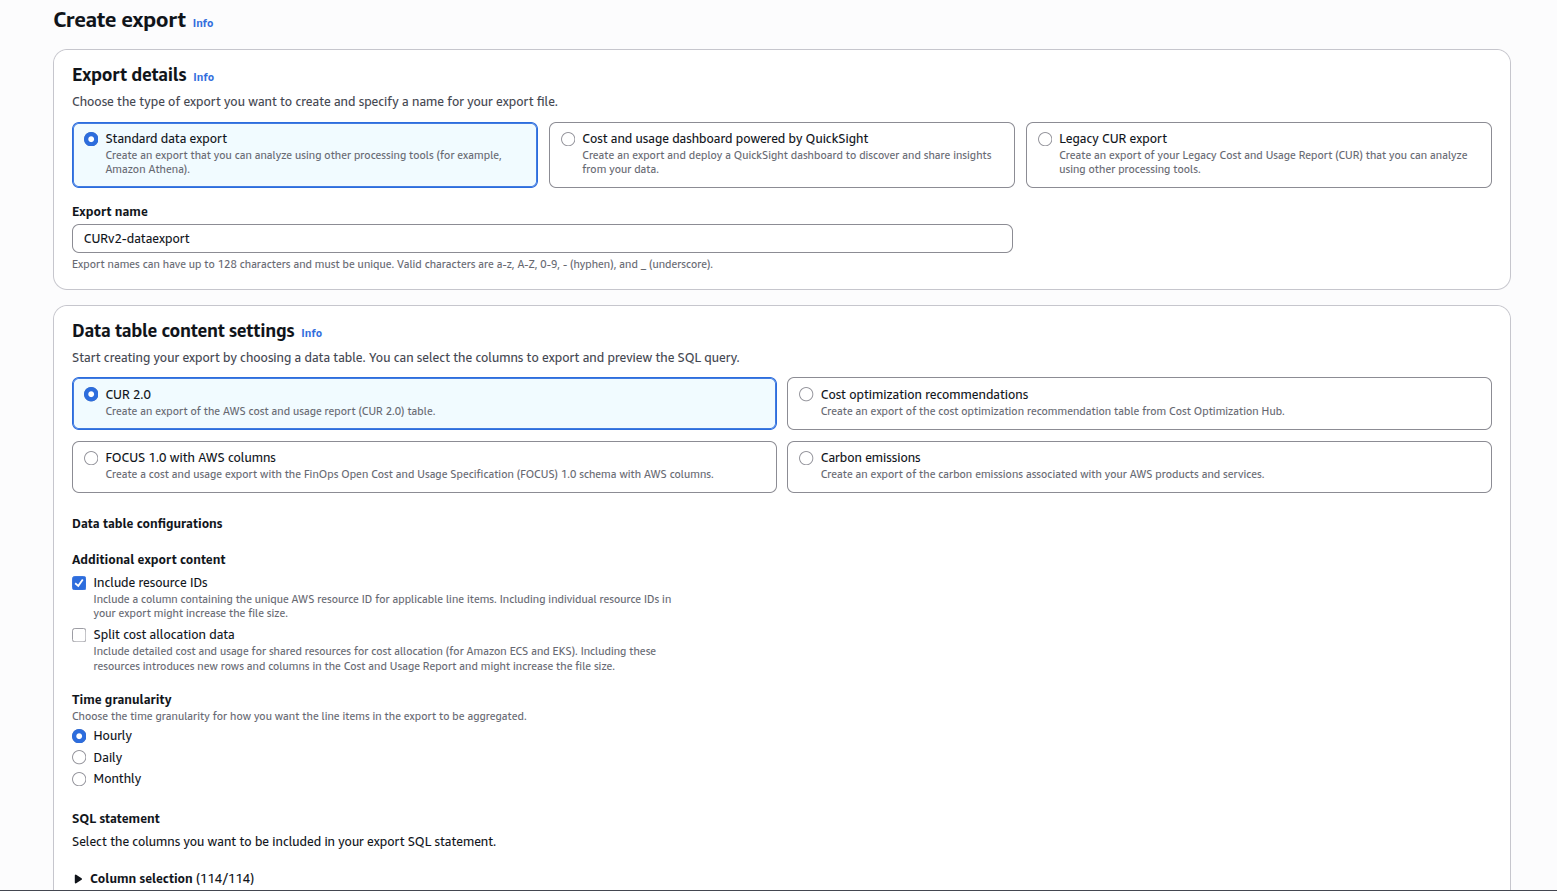
Scroll down to Data export storage settings, select a S3 bucket and a prefix.
If you create a bucket, you should select a region with a low carbon intensity like eu-north-1 (Sweden) or eu-west-3 (France), the emissions related to the storage of the reports will be greatly reduced.
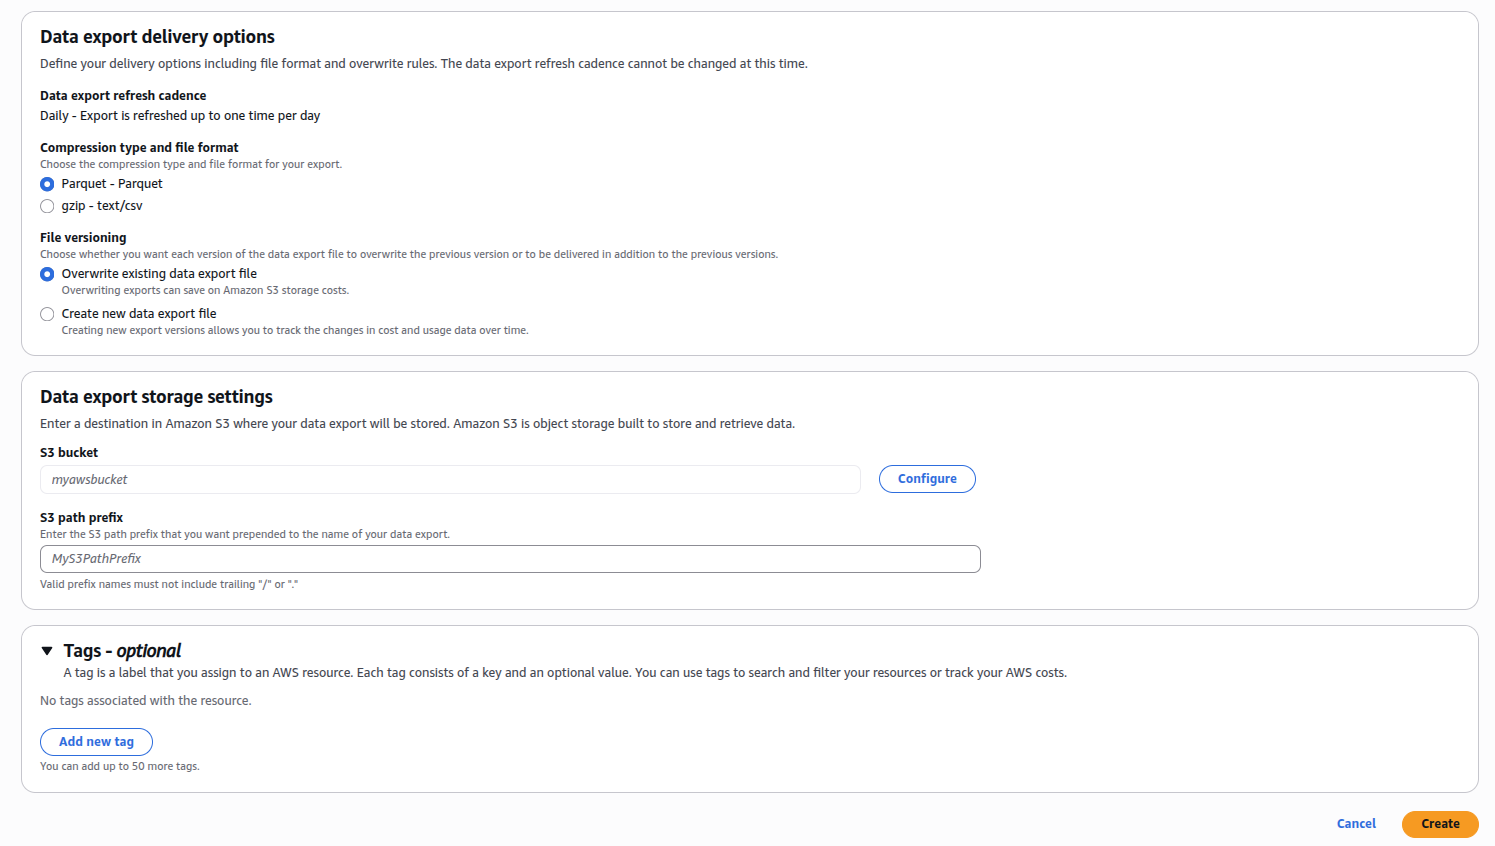
Optionally, add Tags to track the cost and impacts of your GreenOps activities.
Command line
Make sure your AWS keys are exported as environment variables
eval "$(aws configure export-credentials --profile default --format env)"
Copy the script createCUR.sh and run it on the command line. You will be asked to enter a region for the S3 bucket, a bucket name and a prefix.
This should create the bucket where the CUR reports will be stored and configure the Data Export for the CURs.
Run SPRUCE on AWS EMR Serverless
One of the benefits of using SPRUCE is that you can enrich usage reports within AWS without having to expose any of your data to an API or external service.
The easiest way to do this is by running it on AWS EMR Serverless. EMR Serverless is a fully managed, on-demand service that lets you run Apache Spark® without provisioning or managing clusters. You simply submit your jobs, and EMR Serverless automatically provisions, scales, and shuts down the required resources. You pay only for the compute and memory used while your jobs run, making it ideal for episodic, variable, or exploratory data processing workloads.
Since AWS CUR reports are stored on S3, it makes perfect sense to enrich them straight from there without having to copy them.
EMR is also designed to scale, if your CUR reports are large, this is a good way of enriching them.
EMR-Spark-8 ships with a version of Apache Spark compatible with what SPRUCE uses.
Setup
Follow these instructions to set up EMR Serverless on your AWS account. You will also need to install the AWS CLI and have configured it.
We will assume that you have CUR reports on S3. You will also need to make the SPRUCE jar available to EMR by placing it in a S3 bucket.
You can either compile the JAR from the SPRUCE code or grab the one from the release page.
In the example below, we put it in s3://spruce-jars/spruce-0.7.jar but since that bucket name is now taken, you will have to choose a different one.
Run on EMR
Have a look at the user guide.
From the CLI
aws emr-serverless create-application \
    --type spark \
    --release-label emr-spark-8.0-preview \
    --name spark4-SPRUCE
Note the application ID returned in the output. You can always find it with aws emr-serverless list-applications.
Check that the application has been created with
aws emr-serverless get-application \
    --application-id application-id
Next, you launch a job
aws emr-serverless start-job-run \
    --application-id application-id \
    --execution-role-arn job-role-arn \
    --name job-run-name \
    --job-driver '{
        "sparkSubmit": {
          "entryPoint": "s3://spruce-jars/spruce-0.7.jar",
          "entryPointArguments": [
             "-i", "s3://INPUT-curs/","-o","s3://spruce-output/"
          ],
          "sparkSubmitParameters": "--conf spark.executor.cores=1 --conf spark.executor.memory=4g --conf spark.driver.cores=1 --conf spark.driver.memory=4g --conf spark.executor.instances=1"
        }
    }'
where application-id is the one you got when creating the application above.
entryPoint is the location of the SPRUCE jar. The entryPointArguments are where you specify the inputs and outputs of SPRUCE, as explained in the tutorial.
Note the job run ID returned in the output.
Check the results
Depending on the size of your CUR reports, the enrichment will take more or less time. You can check that it has completed with
aws emr-serverless get-job-run \
    --application-id application-id \
    --job-run-id job-run-id
Look at the tutorial for examples of how to query the enriched usage reports.
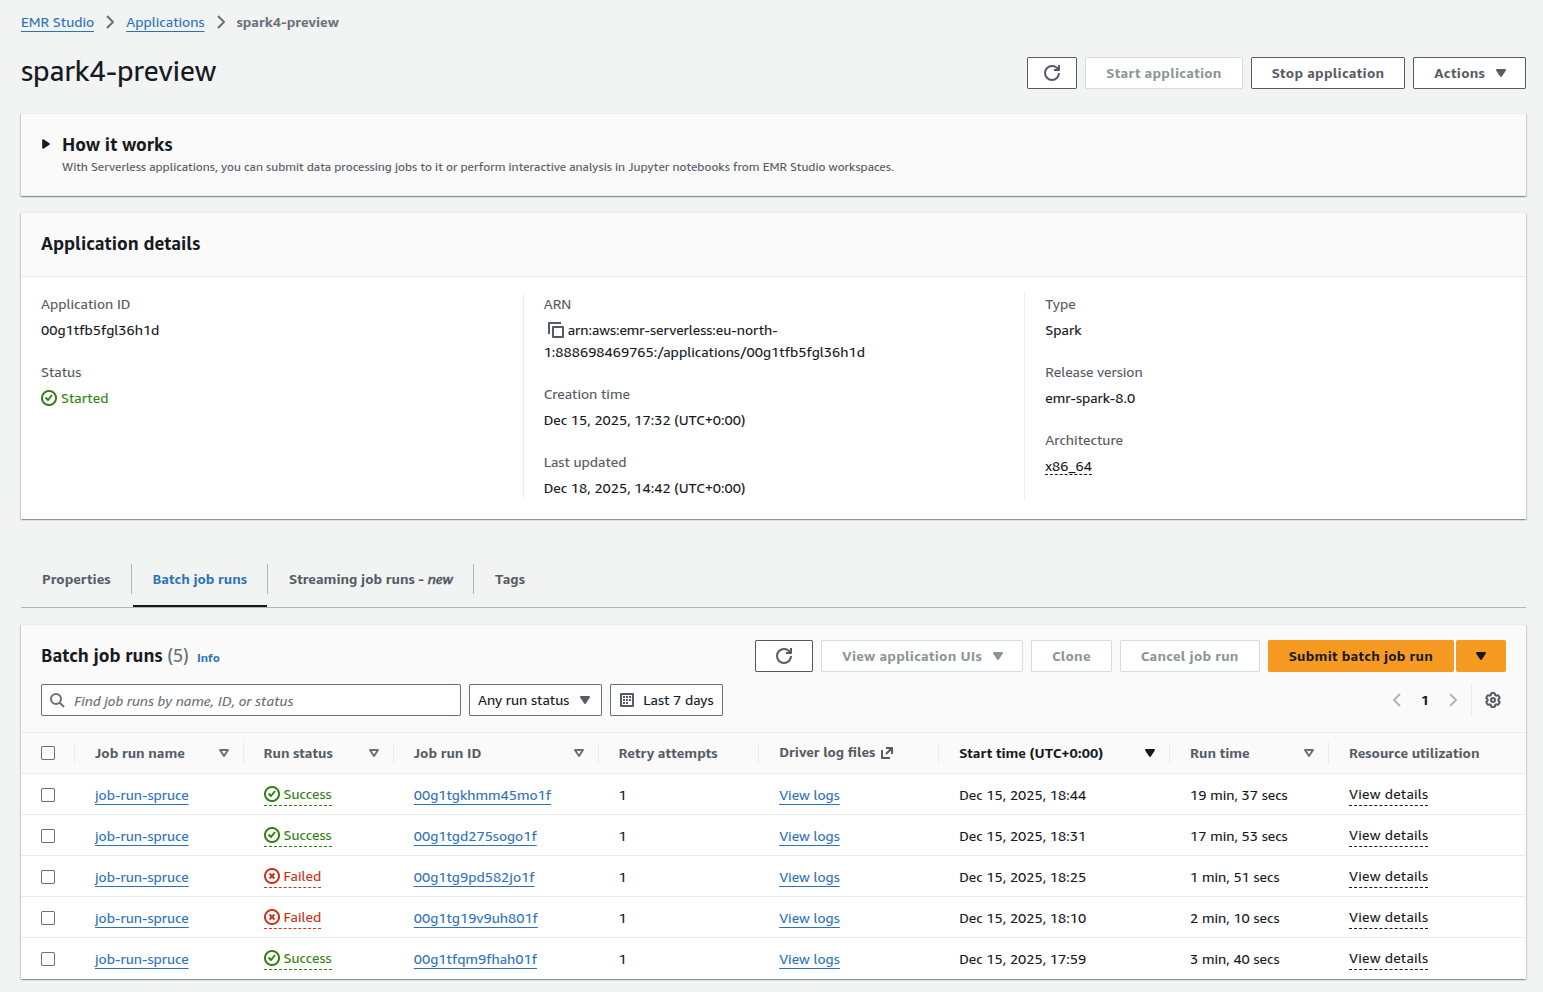
Use the AWS Console
You can of course run EMR using the AWS console. This makes it easier to check the success of a job and access the logs for it.
Read / write to S3
A few additional steps are needed in order to process data from and to AWS S3. For more details, look at the Spark documentation.
Make sure your AWS keys are exported as environment variables
eval "$(aws configure export-credentials --profile default --format env)"
If you want to write the outputs to S3, make sure the target bucket exists
aws s3 mb s3://MY_TARGET_BUCKET
You will need to uncomment the dependency
<artifactId>spark-hadoop-cloud_2.13</artifactId>
in the file pom.xml in order to be able to connect to S3.
With Spark installed in local mode
You need to recompile the jar file with mvn clean package.
then launch Spark in the normal way
spark-submit --class com.digitalpebble.spruce.SparkJob --driver-memory 8g ./target/spruce-*.jar -i s3a://BUCKET_WITH_CURS/PATH/ -o s3a://OUTPUT_BUCKET/PATH/
where BUCKET_WITH_CURS/PATH/ is the bucket name and path of the input CURS and OUTPUT_BUCKET/PATH/ the bucket name and path for the output.
With Docker
After you edit the pom.xml (see above), you need to build a new Docker image
docker build . -t spruce_s3
You need to pass the environment keys and values to the container with -e e.g.
docker run -it --rm --name spruce \
-e AWS_ACCESS_KEY_ID \
-e AWS_SECRET_ACCESS_KEY \
spruce_s3  \
/opt/spark/bin/spark-submit  \
--class com.digitalpebble.spruce.SparkJob \
--driver-memory 4g \
--master 'local[*]' \
/usr/local/lib/spruce.jar \
-i s3a://BUCKET_WITH_CURS/PATH/ -o s3a://OUTPUT_BUCKET/PATH/
Modules configuration
The enrichment modules are configured in a per-provider JSON file bundled in the JAR.
The file used at runtime is selected from the cloud provider (-p / --provider CLI
flag, defaulting to AWS):
| Provider flag | Resource file |
|---|---|
AWS | default-config-aws.json |
GOOGLE | default-config-google.json (when available) |
AZURE | default-config-azure.json (when available) |
The AWS default looks like this:
{
  "modules": [
    {
      "className": "com.digitalpebble.spruce.modules.RegionExtraction"
    },
    {
      "className": "com.digitalpebble.spruce.modules.ccf.aws.Storage",
      "config": {
        "hdd_coefficient_tb_h": 0.65,
        "ssd_coefficient_tb_h": 1.2
      }
    },
    {
      "className": "com.digitalpebble.spruce.modules.aws.Networking",
      "config": {
        "network_coefficients_kwh_gb": {
          "intra": 0.001,
          "inter": 0.0015,
          "extra": 0.059
        }
      }
    },
    {
      "className": "com.digitalpebble.spruce.modules.boavizta.aws.BoaviztAPIstatic"
    },
    {
      "className": "com.digitalpebble.spruce.modules.aws.Serverless",
      "config": {
        "memory_coefficient_kwh": 0.0000598,
        "x86_cpu_coefficient_kwh": 0.0088121875,
        "arm_cpu_coefficient_kwh": 0.00191015625
      }
    },
    {
      "className": "com.digitalpebble.spruce.modules.ccf.aws.Accelerators",
      "config": {
        "gpu_utilisation_percent": 50
      }
    },
    {
      "className": "com.digitalpebble.spruce.modules.ecologits.BedrockEcoLogits"
    },
    {
      "className": "com.digitalpebble.spruce.modules.PUE",
      "config": {
        "default": 1.15
      }
    },
    {
      "className": "com.digitalpebble.spruce.modules.Water"
    },
    {
      "className": "com.digitalpebble.spruce.modules.ember.AverageCarbonIntensity"
    },
    {
      "className": "com.digitalpebble.spruce.modules.OperationalEmissions",
      "config": {
        "powerSupplyEfficiency": 1.04,
        "powerTransmissionLosses": 1.08
      }
    }
  ]
}
This determines which modules are used and in what order but also configures their behaviour. For instance, the Networking module uses different coefficients for intra-region, inter-region, and external data transfers, all configurable via the network_coefficients_kwh_gb map.
Change the configuration
In order to use a different configuration, for instance to replace a module with another one, or change their configuration (like the network coefficient above),
you simply need to write a json file with your changes and pass it as an argument to the Spark job with -c. A custom config passed via -c overrides the per-provider default.
-p still applies when you pass -c: provider-aware modules (such as Water or
AverageCarbonIntensity) need it to pick the correct region-keyed lookups. If your
custom config targets Azure, pass -p AZURE alongside -c so those modules don’t
fall back to the AWS default.
Selecting a provider
If you do not pass -c, SPRUCE picks the bundled config matching the provider:
spark-submit --class com.digitalpebble.spruce.SparkJob ./target/spruce-*.jar \
  -i ./curs -o ./output -p AWS
-p defaults to AWS, so existing AWS workflows do not need to change.
Write a New Module
An EnrichmentModule is the unit of extension in SPRUCE. Each module reads columns from
the CUR input row and/or from values set by earlier modules, then writes its results into a
shared map. The pipeline materialises one output row per CUR row at the end, avoiding
per-module row copies.
Implement the interface
Create a class that implements com.digitalpebble.spruce.EnrichmentModule:
package com.example.spruce.modules;

import com.digitalpebble.spruce.Column;
import com.digitalpebble.spruce.EnrichmentModule;
import org.apache.spark.sql.Row;

import java.util.Map;

import static com.digitalpebble.spruce.CURColumn.LINE_ITEM_PRODUCT_CODE;
import static com.digitalpebble.spruce.CURColumn.USAGE_AMOUNT;
import static com.digitalpebble.spruce.SpruceColumn.ENERGY_USED;

public class MyServiceEnergy implements EnrichmentModule {

    private double coefficient = 0.005; // kWh per usage unit

    @Override
    public void init(Map<String, Object> params) {
        Double value = (Double) params.get("coefficient");
        if (value != null) {
            coefficient = value;
        }
    }

    @Override
    public Column[] columnsNeeded() {
        return new Column[]{LINE_ITEM_PRODUCT_CODE, USAGE_AMOUNT};
    }

    @Override
    public Column[] columnsAdded() {
        return new Column[]{ENERGY_USED};
    }

    @Override
    public void enrich(Row row, Map<Column, Object> enrichedValues) {
        String productCode = LINE_ITEM_PRODUCT_CODE.getString(row);
        if (!"MyServiceCode".equals(productCode)) return;

        double amount = USAGE_AMOUNT.getDouble(row);
        enrichedValues.put(ENERGY_USED, amount * coefficient);
    }
}
columnsNeeded() and columnsAdded()
These declare the module’s dependencies and outputs. SPRUCE uses them to validate the schema at startup — it will fail fast if a required column is missing from the CUR report.
columnsNeeded() should list every column you read, whether from the original CUR row
(CURColumn) or from the shared enrichment map (SpruceColumn).
init()
Called once per partition before any rows are processed. Use it to load configuration
values passed via the JSON config, or to read resource files. The params map is
an empty map (never null) when no config block is present in the JSON.
If your module’s behaviour depends on the active cloud provider (for instance, if it performs region-keyed lookups against a CSV that holds entries for several CSPs), override the provider-aware overload instead:
@Override
public void init(Map<String, Object> params, Provider provider) {
    this.provider = provider;
    init(params);
}
The default implementation delegates to the single-arg init(Map), so modules that
don’t care about the provider don’t need to do anything.
enrich()
Called once per usage row (tax, discount and fee rows are filtered out by the pipeline). Two sources of data are available:
Reading CUR input columns — use the typed getters on CURColumn:
String productCode = LINE_ITEM_PRODUCT_CODE.getString(row);
double amount      = USAGE_AMOUNT.getDouble(row);
boolean missing    = USAGE_AMOUNT.isNullAt(row);

// Optional field — returns null instead of throwing if absent from schema:
String region = PRODUCT_REGION_CODE.getString(row, /* optional= */ true);
Reading values set by earlier modules — use the typed getters on SpruceColumn:
Double energyUsed = ENERGY_USED.getDouble(enrichedValues);
String region     = REGION.getString(enrichedValues);
Both getters return null when the value is absent, so always null-check before using them.
Writing results — put values into the shared map:
enrichedValues.put(ENERGY_USED, computedValue);
If a module only runs for certain rows, simply return early without putting anything into
the map. Columns not written remain null in the output row.
row.fieldIndex() directly. Use CURColumn and
SpruceColumn getters, which cache the field index per schema and avoid
repeated lookups across rows in the same partition.
Register the module
Modules are registered in a JSON config file. Copy the per-provider default (e.g. default-config-aws.json) from the JAR
(or from the repository) as a starting point, then add your module:
{
  "modules": [
    { "className": "com.digitalpebble.spruce.modules.RegionExtraction" },
    { "className": "com.example.spruce.modules.MyServiceEnergy",
      "config": { "coefficient": 0.007 } },
    { "className": "com.digitalpebble.spruce.modules.PUE" },
    { "className": "com.digitalpebble.spruce.modules.ember.AverageCarbonIntensity" },
    { "className": "com.digitalpebble.spruce.modules.OperationalEmissions" }
  ]
}
See instructions on Configure the modules.
Pass the config file to the Spark job with -c:
spark-submit --class com.digitalpebble.spruce.SparkJob ./target/spruce-*.jar \
  -i ./curs -o ./output -c ./my-config.json
PUE must run
after any module that populates operational_energy_kwh, and
OperationalEmissions must run last.
Include your module in the build
If your module lives outside the SPRUCE source tree, build it as a JAR and add it to the Spark job’s classpath:
spark-submit --class com.digitalpebble.spruce.SparkJob \
  --jars ./my-module.jar \
  ./target/spruce-*.jar \
  -i ./curs -o ./output -c ./my-config.json
If you are adding the module directly to the SPRUCE source tree, place it under
src/main/java/com/digitalpebble/spruce/modules/ and run mvn package to include it
in the fat JAR.
See Contribute to SPRUCE if you would like to share the module with the community.
Configure logging
It can be useful to change the log levels when implementing a new enrichment module. The logging in Spark is handled with
log4j. You need to provide a configuration file and pass it to Spark, a good starting point is to copy the
template file from Spark and save it as e.g. log4j2.properties.
The next step is to set the log level for specific resources, for instance adding the section below
# SPRUCE
logger.spruce.name = com.digitalpebble.spruce
logger.spruce.level = DEBUG
will set the log level to DEBUG for everything in the com.digitalpebble.spruce package. In practice, you would be more specific.
Once the modification is saved, you have two options:
-
Rely on the current location of the file and launch Spark with
spark-submit --conf "spark.driver.extraJavaOptions=-Dlog4j.configurationFile=file:///PATH/log4j2.properties" ...where PATH is where you saved the file. Please note that the path to the file has to be absolute. -
With the SPRUCE code downloaded locally, have the file in
src/main/resources/log4j2.properties, recompile the JAR withmvn clean packageand launch Spark withspark-submit --conf "spark.driver.extraJavaOptions=-Dlog4j.configurationFile=./log4j2.properties" .... In this case, the path is relative.
Either way, the console will display the logs at the level specified. Once you have finished working on the code, don’t forget to remove the log file or comment out the section you added.
Split Impact Allocation Data
SCAD
Split Cost Allocation Data or SCAD is an AWS billing and cost management feature that helps organizations gain fine-grained visibility into how cloud resources are shared and consumed across multiple services, accounts, or workloads.
When enabled, it ensures that shared costs — such as data transfer, EC2 instances, or load balancers — are allocated proportionally among all linked resources or cost allocation tags. This becomes particularly important in containerized and multi-tenant environments such as Kubernetes on AWS.
In Kubernetes, a single EC2 instance, EBS volume, or Elastic Load Balancer can support multiple pods, namespaces, or even different applications. This makes it difficult to understand:
- How much a specific team, application, or namespace costs.
- Which workloads are driving the majority of the cluster’s cloud expenses.
- How to accurately charge back or show back costs to different business units.
Without split allocation, costs appear aggregated at the resource level rather than the usage level, making accurate chargeback or budgeting almost impossible.
Split cost allocation data introduces new usage records and new cost metric columns for each containerized resource ID (that is, ECS task and Kubernetes pod) in AWS CUR. For more information, see Split line item details.
How to Enable Split Cost Allocation Data
When defining the CUR data export, activate the options Split cost allocation data as well as Include resource IDs. See Generate Cost and Usage Reports for more details.
From Cost to Impact allocation
A similar problem happens with the environmental impacts estimated by SPRUCE. The split line items (e.g. K8s pods) have a cost associated with them but the emissions and other environmental impacts are still only associated with the AWS resources.
SPRUCE has a separate Apache Spark job which:
- groups all the line_items by hourly time slot and resourceID
- gets the sum of all the impacts for the resources (EC2, volume, network)
- gets the sum of the split usage ratios
- allocates the impacts on the splits based on their usage ratios
Please note that the impact columns for the splits have a prefix split_, e.g split_operational_energy_kwh so that they are not counted twice: once with the resources and then again with the splits.
See example query below.
Run the SplitJob
The call is similar to how you run Spruce
spark-submit --class com.digitalpebble.spruce.SplitJob --driver-memory 8g ./target/spruce-*.jar -i ./enriched_curs -o ./enriched_curs_with_splits
An option -c allows to specify the impact columns to attribute to the splits. By default its value is "operational_energy_kwh, operational_emissions_co2eq_g, embodied_emissions_co2eq_g".
This can be changed to cater for columns generated by services other than SPRUCE, including commercial ones such as GreenPixie or TailPipe.
Display the results
You can then query the CURs with the enriched splits. For instance to get the total of CO2eq emissions by EKS namespace:
create table spruce as select * from 'enriched_curs_with_splits/**/*.parquet';

SELECT
      tag.key,
      tag.value AS namespace,
      SUM(split_operational_emissions_co2eq_g) AS total_carbon
  FROM spruce,
      UNNEST(resource_tags) AS t(tag)
  WHERE tag.key = 'aws_eks_namespace'
  GROUP BY tag.key, tag.value order by total_carbon desc;
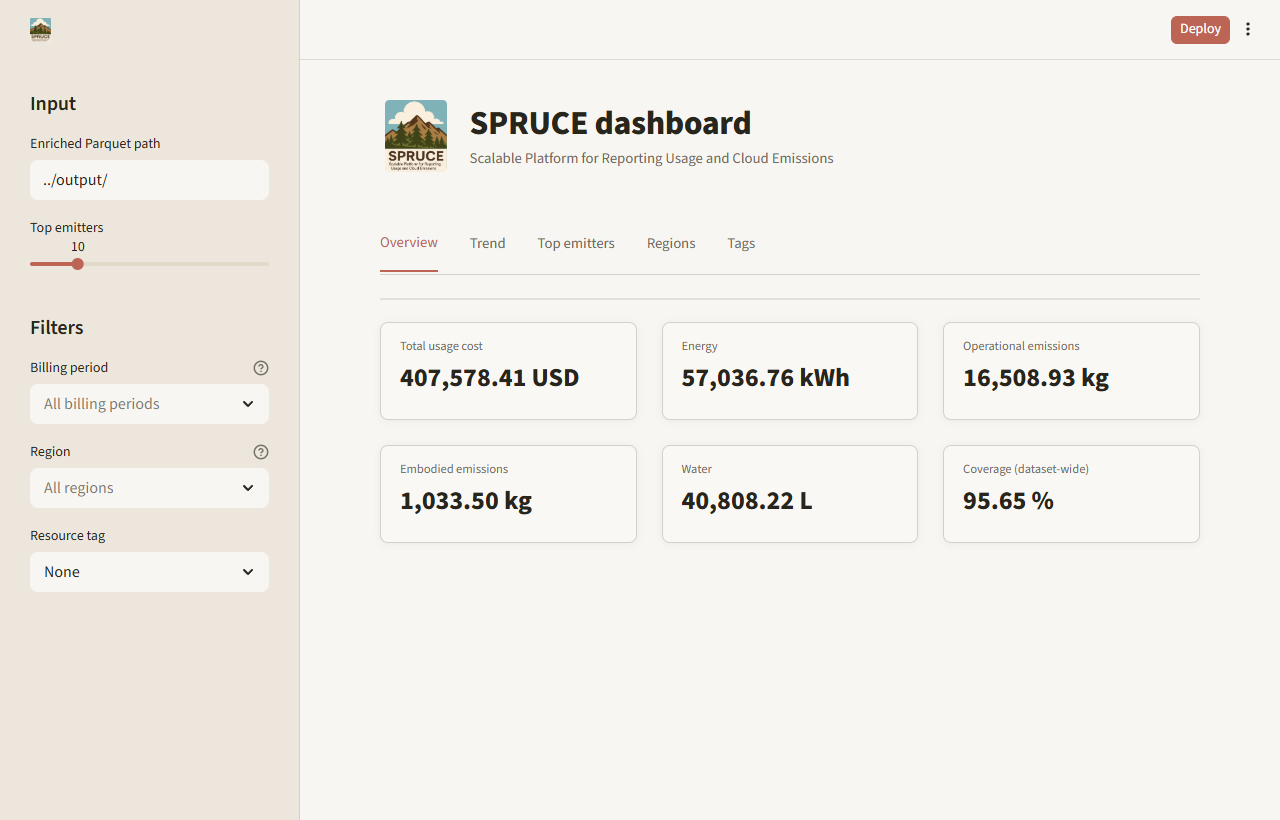
Build a simple dashboard
The repository includes reporting/dashboard.py, a Streamlit
example that reads SPRUCE-enriched Parquet output and runs interactive DuckDB
queries locally to explore cost, energy, emissions, water, region, and tag
breakdowns.
Install
pip install -r reporting/requirements-dashboard.txt
Run
Run the dashboard from the reporting/ directory. Point it at a local output
directory, a glob, a single Parquet file, or an S3 URI:
cd reporting
streamlit run dashboard.py -- --input ../output/
streamlit run dashboard.py -- --input '../output/**/*.parquet'
streamlit run dashboard.py -- --input s3://my-bucket/spruced/
The -- separator is required when passing dashboard arguments through
Streamlit; without it, Streamlit consumes options such as --input.
For S3 input, DuckDB uses its httpfs extension and the ambient AWS credential
chain, matching the pattern used by report.py.
To generate a small local dataset for review or demos:
python scripts/gen_synthetic.py -o output/synth.parquet
cd reporting
streamlit run dashboard.py -- --input ../output/
If output/synth.parquet already exists, pass --force to overwrite it:
python scripts/gen_synthetic.py -o output/synth.parquet --force
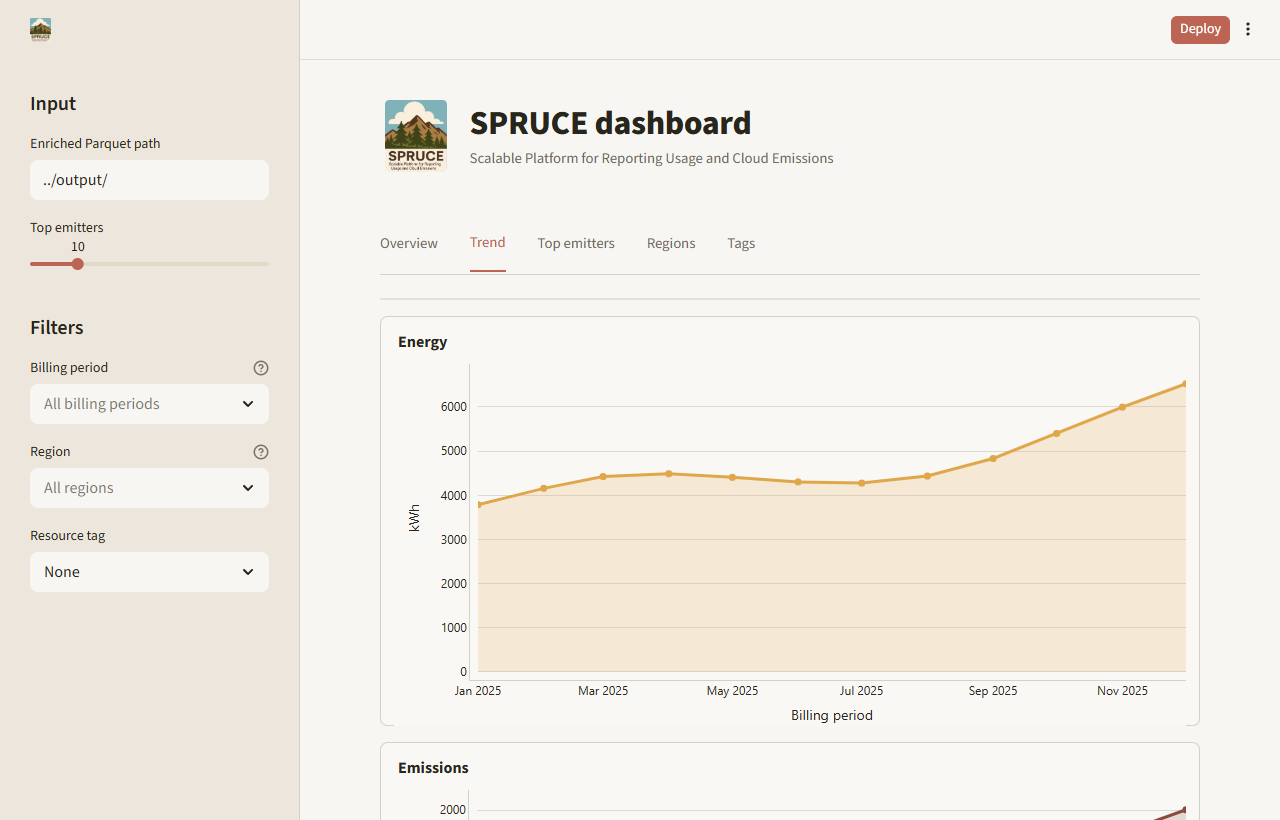
What it shows
| Section | What it shows |
|---|---|
| Overview | Total usage cost, energy, operational emissions, embodied emissions, water usage, and cost coverage for the full input |
| Trend | Separate energy, total emissions, and water charts by billing period |
| Top emitters | Sorted top product/service/operation combinations as a table-first view |
| Regions | Emissions share by region, plus regional KPI cards and detail table |
| Tags | Sorted tag-value chart and table for a selected resource_tags key |
Use the sidebar to filter by billing period and region. If resource_tags are
present, choose one tag key to break down emissions by tag value. The cost
coverage KPI matches report.py and is calculated across the full input, not
only the currently selected filters.
Screenshots
Customize
To add metrics or charts, edit the SQL query helpers in
reporting/dashboard.py. They match the query shapes in report.py, so
changes can usually be copied between the two.
Streamlit caches the DuckDB connection per input path during a session. When switching between several large inputs, restart the app to release old in-memory connections.
Alternatives
For a static report, use python report.py -o report.html or
python report.py -o report.pdf. For a full BI stack, point Tableau, PowerBI,
Superset, or similar tools at the same enriched Parquet output through DuckDB,
Athena, or another query layer. See the
comparison with other open source tools for broader
context.
Contributing to Spruce
============================
Thank you for your intention to contribute to Spruce. As an open-source community, we highly appreciate contributions to our project.
To make the process smooth for the project committers (those who review and accept changes) and contributors (those who propose new changes via pull requests), there are a few rules to follow.
Contribution Guidelines
We use GitHub Issues and Pull Requests for tracking contributions. We expect participants to adhere to the GitHub Community Guidelines (found at https://help.github.com/articles/github-community-guidelines/ ) as well as our Code of Conduct.
Please note that your contributions will be under the ASF v2 license.
Get Involved
The Spruce project is developed by volunteers and is always looking for new contributors to work on all parts of the project. Every contribution is welcome and needed to make it better. A contribution can be anything from a small documentation typo fix to a new component. We especially welcome contributions from first-time users.
GitHub Discussions
Feel free to use GitHub Discussions to ask any questions you might have when planning your first contribution.
Making a Contribution
- Create a new issue on GitHub. Please describe the problem or improvement in the body of the issue. For larger issues, please open a new discussion and describe the problem.
- Next, create a pull request in GitHub.
Contributors who have a history of successful participation are invited to join the project as a committer.
Resources
-
Presentation - Boavizta meetup - February 13th 2026